App Spend Dashboard
See exactly where your software budget goes — by app, department, and user — and find savings before renewals hit.
Overview
SaaS sprawl is one of the biggest hidden costs in modern organizations. Teams sign up for tools independently, subscriptions renew quietly, and before long you are spending thousands on software that nobody fully tracks. The App Spend Dashboard exists to solve that problem by bringing every subscription, renewal date, and per-user cost into a single view.
This dashboard aggregates subscription data that you enter for each app and presents it alongside user and department information from your directory. Instead of chasing invoices across vendors, you get a centralized picture of where your software budget is going and where you can save.
How It Works
You enter subscription and cost details for each app through the Subscription tab on the app detail page -- plan type, billing cycle, per-user cost, and renewal date. ShiftControl combines that data with your organizational structure (departments, users, groups) to calculate costs at every level, from individual users up to the entire company.
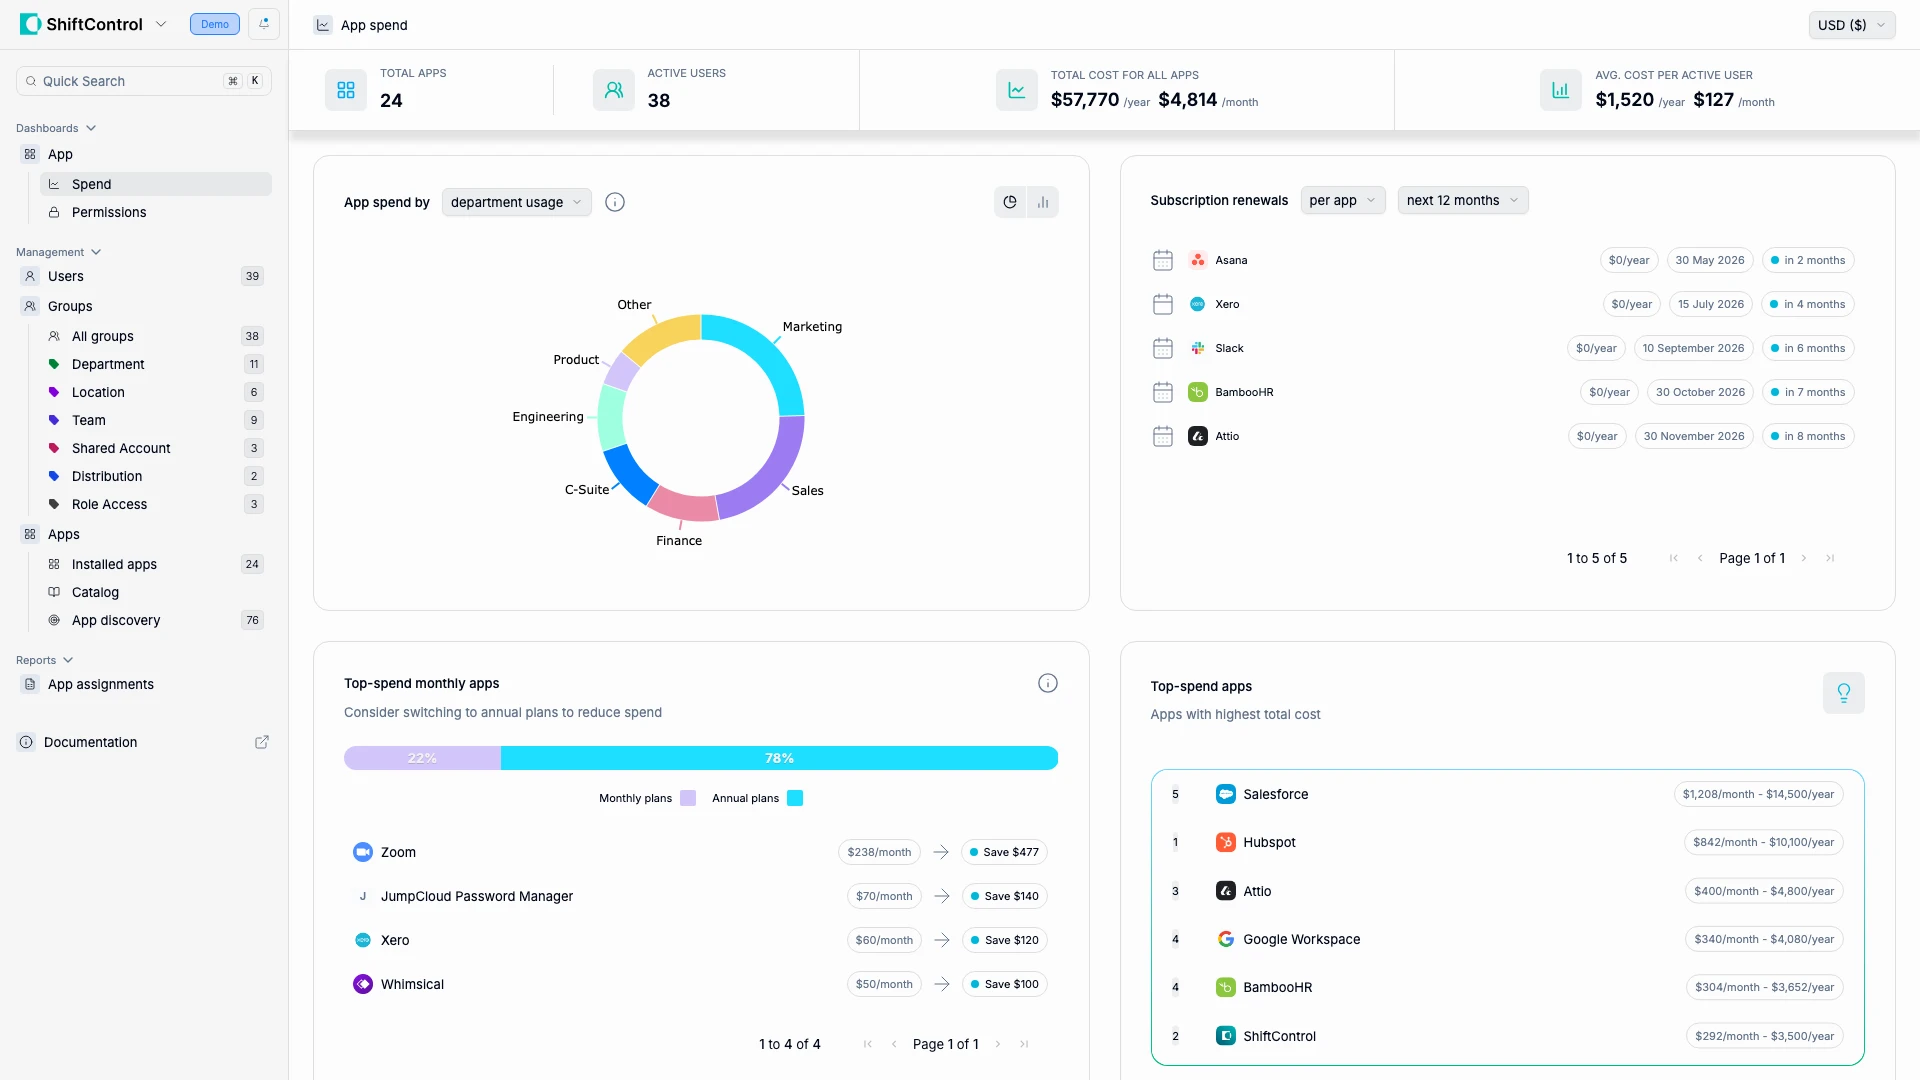
The dashboard updates as you add or change subscription data, so the numbers reflect your latest entries. Here is what the header metrics tell you at a glance:
- Total Apps -- The number of apps with tracked subscriptions (e.g., 24 apps across your organization).
- Active Users -- How many people are currently assigned to at least one paid app (e.g., 35 active users).
- Total Cost -- Your combined annual and monthly software spend (e.g., $57,770/year or $4,814/month).
- Avg Cost per Active User -- What you spend on software per employee (e.g., $1,651/year or $138/month).
Use the currency selector in the top-right corner to switch between available currencies for cost reporting. All dashboard figures will recalculate to the selected currency.
Common Scenarios
Scenario: Preparing for budget season
Your finance team needs a breakdown of software costs by department for the upcoming fiscal year. Instead of manually requesting receipts from every team lead, open the App Spend Dashboard, toggle the spend-by-department view, and export the data. You can see that Marketing accounts for the largest share of SaaS spend, followed by Sales and Engineering, and use those numbers directly in your budget planning.
Scenario: Catching a renewal before it auto-renews
A $14,000/year Salesforce contract is coming up for renewal next month. The Subscription Renewals panel flags it with enough lead time for you to review usage, negotiate pricing, or consolidate licenses before the charge hits.
Scenario: Identifying savings opportunities
You notice several apps on monthly billing plans in the Top-Spend Monthly Apps section. The dashboard shows that switching Zoom and Whimsical from monthly to annual billing would save your organization hundreds of dollars per year with no change in functionality.
App Spend by Department
The App Spend by visualization breaks down your SaaS budget by department -- Marketing, Sales, Finance, Engineering, C-Suite, Product, and others. You can toggle between grouping modes like department usage or app category to see the same data from different angles.
This matters because SaaS costs are rarely distributed evenly. One department might account for 40% of your total spend. Knowing that helps you:
- Prioritize license audits in the highest-spending departments
- Spot underutilized licenses in smaller teams that still carry full-price subscriptions
- Make informed decisions about budget reallocation during renewals
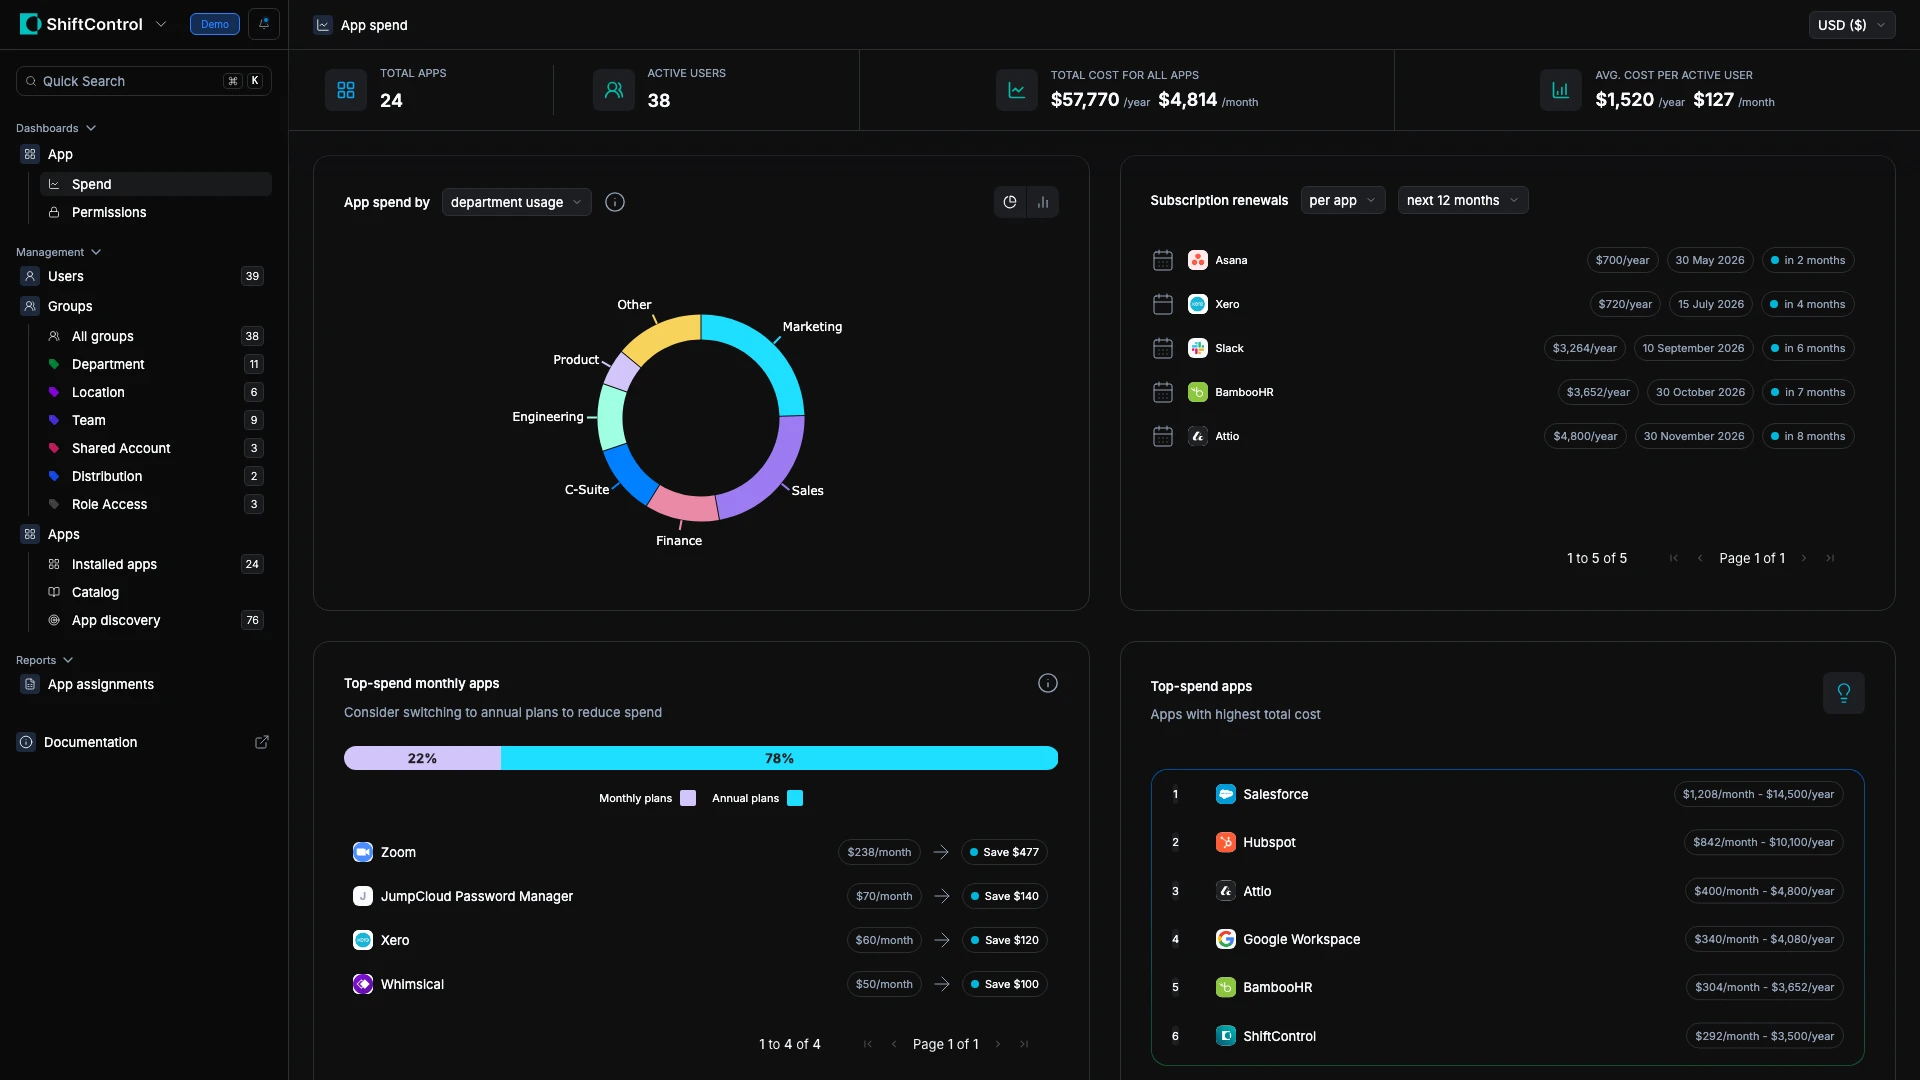
Subscription Renewals
The Subscription Renewals panel shows what is coming due and when. You can filter the view to focus on what matters most:
- Per app -- See renewals for individual applications like Figma, Asana, Xero, Slack, BambooHR, or Attio
- Per department -- Track renewals grouped by organizational unit
- Time window -- Adjust from next 12 months down to 6 months or 30 days
Each renewal entry displays the app name and icon, the cost and billing frequency, and the renewal date. This gives finance teams and IT administrators a shared calendar of upcoming commitments so nothing slips through unnoticed.
Top-Spend Apps
The Top-Spend Apps section ranks your most expensive subscriptions so you know exactly where the bulk of your budget goes. These are the apps worth scrutinizing during renewal negotiations.
Each app shows its annual cost with a clear ranking:
- Salesforce -- $14,500/year
- HubSpot -- $10,100/year
- Attio -- $4,800/year
- Google Workspace -- $4,080/year
- BambooHR -- $3,652/year
- ShiftControl -- $3,500/year
Seeing your top spenders in one place makes it easy to identify which vendor conversations will have the biggest budget impact.
Top-Spend Monthly Apps
This section highlights apps currently on monthly billing plans and compares their costs against what you would pay annually. A bar chart shows the annual vs. monthly cost side by side for apps like Zoom, Xero, Whimsical, and JumpCloud Password Manager.
The insight here is straightforward: monthly plans are almost always more expensive than annual commitments. If you see a tool your team plans to keep for the next year, switching to annual billing is one of the simplest cost optimizations available.
Annual plans typically come with 10-20% discounts and make budgeting more predictable for finance teams. Review this section quarterly to catch any new monthly subscriptions that would benefit from an annual switch.
Complete Subscription Info
If any subscription is missing cost or renewal data, the dashboard displays a Complete subscription info prompt. Filling in this data is important because the dashboard can only calculate accurate forecasts and per-user cost metrics when it has complete information.
Adding missing data for apps like Apple Business Manager, AWS, or Canva takes a moment but significantly improves the accuracy of your spend reporting.
High-Cost Users
The High-Cost Users panel identifies individuals whose combined app subscriptions exceed your organization's average per-user cost. This is not about penalizing anyone -- it is about finding optimization opportunities.
Common reasons a user shows up here include:
- They have licenses for overlapping tools that serve the same purpose
- They retained access to apps from a previous role or project
- They are on a premium tier when a standard tier would suffice
Reviewing this list during renewal planning helps you consolidate licenses and ensure each user has exactly the access they need.
Things to Know
- Data accuracy depends on completeness. The dashboard can only report on apps that have subscription data entered. Use the "Complete subscription info" prompts to fill gaps.
- Currency conversion is display-only. Switching currencies recalculates the view but does not affect underlying subscription records.
- Renewal dates come from subscription data. If a renewal date is wrong, update it in the app's subscription settings rather than on the dashboard itself.
- Per-user costs include all assigned apps. If a user is assigned to an app but never logs in, their cost still reflects that license.
- Department breakdowns require department assignments. Users without a department will appear under "Other" in the spend-by-department view.
Related Features
- App Management -- Add, edit, and manage the apps that feed into this dashboard
- App Permissions Dashboard -- Monitor third-party app authorizations and access risks
- Departments -- Configure the department structure used in spend breakdowns
- App Assignment Reports -- Export detailed reports on which users are assigned to which apps
- Connector Management -- Connect the apps and services that provide subscription data